
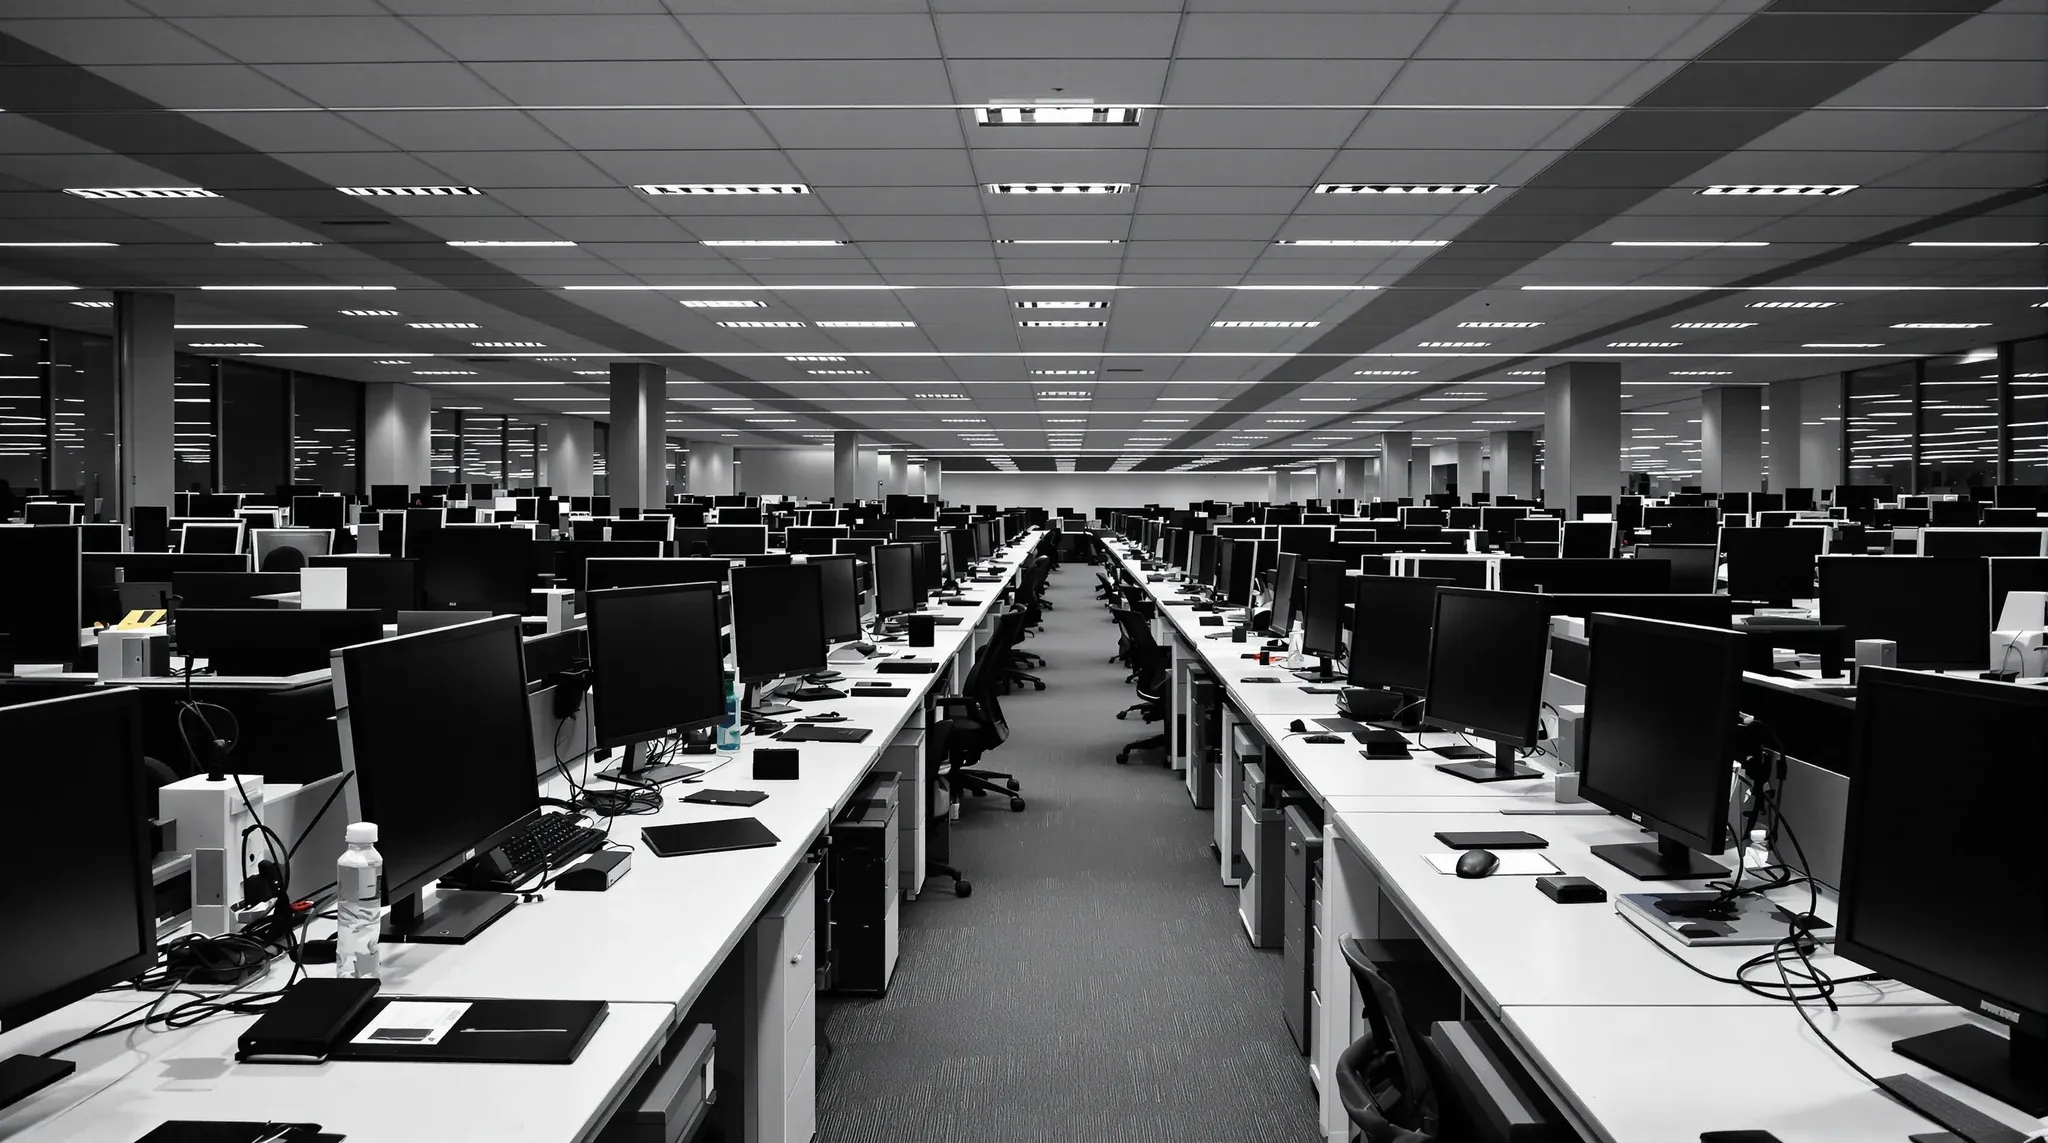
Workpoint density in current Sydney commercial practice sits across three honest tiers. Generous fitouts run at fifteen to eighteen square metres of net lettable area per workpoint, including circulation and shared zones. Standard fitouts run at ten to fourteen square metres per workpoint. High-density fitouts run at seven to nine square metres per workpoint, and below that the floor starts to fail on services capacity, acoustic performance, egress comfort or daylight access regardless of how the desks are arranged.
The density decision is usually framed as a desk-counting exercise but it is closer to a layout-and-services exercise. Setting density first and then designing the floor against it locks in compromises that are expensive to unwind later. Setting it from the floor’s actual capacity, the building’s constraints and the way the team will use the space gives a number the fitout can deliver without overcrowding.
The Honest Density Tiers In Current Sydney Practice
The numbers above include all the floor area, not just the desk footprint. A workpoint at twelve square metres per person includes the desk and chair, the circulation around it, a proportional share of the meeting rooms, the breakout zone, the kitchen, the reception and any back-of-house area on the floor. Counting only the desk footprint produces a much smaller number that does not survive the rest of the layout being built around it.
The Australian Building Code reference of ten square metres per person is a population density figure used for egress and ventilation calculations, not a workpoint planning figure. It assumes ten people occupying ten square metres each at peak occupancy, including all the supporting spaces on the floor. Treating it as the planning target rather than the regulatory floor produces a tenancy that is technically compliant but uncomfortable to work in.
The Queensland government’s office accommodation standard, which is widely referenced in Australian practice, uses twelve square metres per workpoint as a benchmark for general office space. This is a useful reference point because it includes the supporting spaces and reflects what a comfortable contemporary floor delivers. Most well-resolved Sydney commercial fitouts sit between ten and fourteen square metres per workpoint, which lines up with this benchmark.
Why Density Drives The Rest Of The Layout
The density decision sets the operating envelope for almost every other planning decision. The number of workpoints determines the number of meeting rooms the floor needs at typical ratios of one room per ten or twelve workpoints. The breakout zone has to scale with the population that will use it. The kitchen has to handle the morning and lunchtime peak loads. The toilet count is set by the building code based on the floor’s occupancy.
The mechanical services capacity scales with the population density. A floor designed for forty people uses HVAC differently from a floor designed for eighty in the same area, and base building HVAC capacity is fixed for the life of the building. Pushing density above what the base building can comfortably cool means either accepting a warmer floor at peak times or installing supplementary cooling, which adds capital cost and ongoing operating cost.
The lighting and power densities scale similarly. Each workpoint needs power, data, task lighting that integrates with the general lighting design, and adequate ambient lighting. Doubling the desk count on the same floor doubles the power and data outlets, doubles the lighting density, and changes the lighting design from general illumination to task-and-ambient as the desk spacing tightens.
The egress requirements change too. The building code calculates required exit width and travel distance based on occupant density, and a high-density floor may need additional egress capacity, modified door swing directions, or layout changes around the exit paths. These are expensive to add late in the design and are easy to absorb early if the density is honest.
What The Numbers Actually Reflect
Behind each density tier is a different operating model. The fifteen-to-eighteen square metre tier reflects a traditional office with assigned desks, generous circulation, multiple meeting rooms per team, and substantial breakout and amenity provision. This was the standard for premium Sydney commercial fitouts through the nineties and two thousands and is still used in legal, financial and executive tenancies where the per-person investment supports the spend.
The ten-to-fourteen square metre tier reflects contemporary general office practice. Assigned desks are typical but not universal, meeting rooms run at moderate ratios, breakout is the second layer of the floor’s social infrastructure rather than a generous primary feature, and circulation is sized for normal flow rather than for spaciousness. Most professional services, technology, corporate head office and government tenancies in Sydney now sit in this band.
The seven-to-nine square metre tier reflects high-density operations: call centres, contact centres, processing teams, customer-service operations and some sales floors. These are high-utilisation spaces with long daily occupancy hours and high heat loads, and they need ceiling and services design that match. Below seven square metres per person, the floor stops being an office and starts being a workshop, with all the constraints that implies.
Hybrid Work And Utilisation Rates
Hybrid working has changed the density conversation more than any other workplace shift in recent years. A floor designed for assigned desks at one hundred per cent attendance carries a different population than the same floor designed for sixty per cent average attendance with desk-sharing in place. The headcount the floor supports is the registered population times the utilisation rate times any hot-desking ratio.
Honest utilisation data matters more than aspirational targets. A team that says it will be in three days a week often averages closer to two and a half, and the desk-sharing ratio that the design assumes needs to reflect the lower number. Designing to optimistic utilisation produces a floor that is overcrowded on the busiest days and emptier than expected on the average day, which is the worst of both outcomes.
The peak-occupancy day is what the services and the egress have to handle. A floor designed for thirty desks at one hundred per cent attendance may register sixty desks if utilisation runs at fifty per cent, but the HVAC, egress and amenity have to handle whatever the peak day produces, not the average day. The density calculation needs to test the peak as well as the average, and the design has to comfortably handle both.
Activity-Based Vs Assigned-Desk Density
Activity-based working changes the density calculation by separating workpoints from desks. A team using activity-based settings has a fluid mix of focus desks, collaboration tables, phone booths, project rooms and quiet zones, and the workpoint count is the sum of all the working positions across the floor rather than just the desks. The total floor area per registered person is similar to assigned-desk density at the same utilisation, but the spatial distribution is different.
The shared-space ratio is higher in activity-based fitouts, which means more meeting rooms per population, more breakout per population and more variety of working settings. This adds operating cost in the form of services and amenity provision but reduces the number of dedicated desks the floor needs, which can compensate. The net floor area per person is comparable but the floor reads differently and supports a different working model.
The mistake activity-based designs make most often is keeping the desk density as if every person still needed a desk and adding the activity-based settings on top. This ends up at a density tier the floor cannot support, with the activity-based settings competing for floor area against the desks they were supposed to substitute. The whole calculation only works when the desk count is genuinely lower than the registered population.
Where High-Density Fails
Pushing past the ten-square-metre threshold without a deliberate operating model produces predictable failures. Services capacity is the first to give. The HVAC starts to struggle on warm days, the lighting design feels inadequate for the desk density, the power and data infrastructure runs at the limit of its rated capacity, and the toilet provision starts to bottleneck at peak times.
Acoustic performance is the second. Higher density means more concurrent speech in the same room volume, which raises the ambient noise level. The same ceiling that worked for forty people becomes inadequate for sixty, and the perception of acoustic comfort drops faster than the population rises. Floors that push density without strengthening the ceiling and introducing sufficient enclosed and acoustic spaces often need an acoustic retrofit within the first year of occupation.
Egress and circulation comfort is the third. The building code gives a minimum exit capacity and travel distance, but the comfort of circulation falls before the code limit is reached. Aisles between desks that are technically wide enough but feel cramped, breakout zones that can only seat a fraction of the population at any one time, and meeting rooms that are perpetually fully booked all reflect a floor pushed past the density it can comfortably support.
Daylight and outlook is the fourth. High-density floors put more people further from the perimeter and the windows. The interior of the floor becomes the dominant work zone for a larger share of the team, and unless the lighting and the spatial design work hard to compensate, the floor reads as compressed regardless of the actual square metres per person.
How To Test The Density Brief Before Locking The Layout
Three tests are worth running before the density target is locked. The first is a back-calculation from the building’s services capacity. The base building HVAC, the available power, the toilet provision and the egress capacity all set ceiling values for population density on the floor, and the proposed density should sit comfortably below those ceilings rather than at them. A design that is at the limit of base building capacity will not handle peak days well.
The second is an honest read of utilisation. The proposed density should be tested against the worst-case day in a typical month, not the average day. A floor that supports the average day but fails the busiest day produces complaints from the team and reactive remediation from the tenant within months of occupation.
The third is a pre-occupation walk through the layout at desk level. Mocking up a section of the proposed layout with desks, chairs and circulation spacing at full scale, and walking it with people who will use it, often reveals that the density looks comfortable on a plan and feels tight in person. The earlier this gap is identified, the cheaper it is to widen the spacing or reduce the desk count to a level that holds up in occupation.
If you are setting the workpoint density for a Sydney commercial office fitout and want a read on what the building can actually support comfortably and what density tier suits the way your team will use the space, we can walk through the building constraints, the brief and the operating model with you before the layout is locked.
📞 Call us on 1300 60 93 93